2021-01-04
10 KPIs to track for Amazon Sellers

On Seller Central, many KPIs are available to sellers, yet not all of them are clear in their calculation method or are too macro to have an ASIN by ASIN view.
Our Amazon experts have put together a list of 10 KPIs to focus on to effectively manage your Seller business on Amazon (if you are a vendor, here is the top 10 KPIs to track for Amazon Vendors).
1. In stock rate
The in stock rate represents the number of days without a stockout. It is a key element because being out of stock impacts your visibility in the long term. The higher this rate is, the better.
🔎 How to calculate the in-stock rate: On Seller Central, it is possible to download the daily inventory history for each product. With a simple pivot table, it is easy to identify the exact days on which there was a stock shortage. This allows you to determine possible problems at a micro level.
⏱ Frequency: We recommend you look at this KPI on a regular basis as you need to be able to react quickly if the situation gets worse.
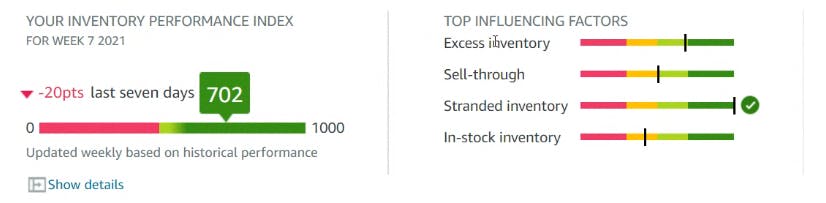
2. Inventory performance index (For FBA Sellers only)
This indicator is calculated by Amazon, and gives you a global view of your inventory and your turnover rate. It is important because below 450, restrictions are automatically applied by Amazon. For example, there is a limit to the quantities that can be sent.
🔎 How to calculate the inventory performance index: The IPI (Inventory Performance Index) is directly available in Seller Central.
⏱ Frequency: Monitor this KPI monthly to make sure it stays stable.
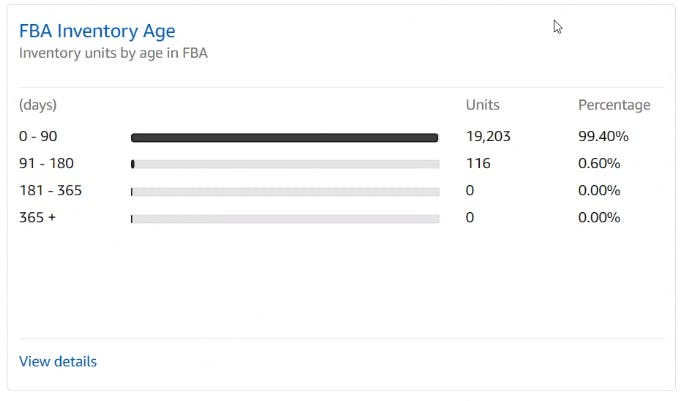
3. Average age of inventory or excess inventory (for FBA Sellers only)
The average age of products in Amazon warehouses or excess inventory directly impacts the IPI.
Our experts recommend aiming for a good turnover rate and doing shipments approximately every three months.
🔎 How to calculate the average age of inventory: The average age of the inventory is directly available in Seller Central for FBA Sellers. Below is an example of very good results.
⏱ Frequency: Monitor this KPI two to three times a month.
4. Basket analysis
To identify growth opportunities, we recommend that you regularly analyze your shopping cart KPIs: – Average number of units purchased, Average basket, and Average selling price of your products.
This can help you to identify potential product combinations and use virtual bundles to grow your business.
🔎 How to calculate those KPIs: All these KPIs are available on Seller Central.
⏱Frequency: We advise you to do this analysis every quarter to make sure you are on the right track to identify possible optimization opportunities.
5. Reviews
It’s no secret that Amazon’s A10 algorithm places a lot of importance on reviews.
This is why we advise you to keep an eye on the number of reviews and the average rating per product.
If these two KPIs aren’t good, it is important to determine where the problem is coming from. A good way to reverse the trend is to launch a Vine campaign.
🔎 How to track your review score: Amazon is starting to offer a pretty clear view of these KPIs on Amazon Seller Central in the US.
Many retail analytics tools also allow you to easily monitor your popularity on Amazon. For example with the tool J+ Retail Analytics.
⏱ Frequency: Keep an eye on your reviews on a monthly or quarterly basis.
7. Traffic KPIs
Any Seller, no matter what size or category, must have a clear vision of the traffic on their product pages. This is essential because it allows you to identify areas for improvement or sudden problems that need to be addressed.
Our experts recommend tracking the number of views and sessions. These two indicators allow you to evaluate if users come back to the page often before making a purchase.
And of course, the number of clicks to determine the conversion rate is also important. A bad conversion rate can be due to things like bad customer reviews or a non-optimized product page.
Knowing which ASINs generate the most traffic also allows you to know where to look for growth or where to concentrate your investments.
🔎 How to calculate traffic KPIs These indicators are available in Seller Central at ASIN level.
⏱ Frequency Although it is possible to follow these KPIs on a daily basis, to get a better view, we advise you to filter by week or month. This is because there can be many variations from one day to another (weekend or weekday, weather, holidays etc.)
8. Buy box percentage
This KPI indicates how many times a product had the buy box. If it’s below 50%, there are improvements that need to be implemented to increase this rate and get more growth.
To increase your buy box rate we recommend 2 axes: Price and logistics.
- The price: If the product is too expensive you will lose the buy box to a more competitive Seller. You can use the dynamic price rule available on Seller Central to automatically adjust your prices to maximize your buy box holding.
- Logistics: If you are in “shipped by Seller” format, switching to “shipped by Amazon” format can improve your delivery time and conditions in order to increase your buy box rate and therefore your sales.
🔎 How to calculate the buy box percentage: Your buy box percentage is available in Seller Central.
⏱ Frequency: Monitor this KPI weekly.
9. Refund rate
This KPI evaluates how many times your product is returned. It should obviously be close to zero.
If you have a lot of returns, try to determine the reasons why and adapt your product page accordingly (maybe consumers misunderstood the product's use), or make sure that your product has no particular defects.
🔎 How to calculate the refund rate: This is available for everyone on Seller Central.
⏱ Frequency: We advise you to look at this KPI on a monthly or quarterly basis.
10. Unit session percentage
The unit session percentage, close to the conversion rate, allows you to determine out of 100 visits how many will result in a sale.
This KPI is important to determine if there is a problem with traffic or conversion; is your conversion rate low because the traffic is low (you advertised with a bad keyword) or because the content is not up to date? In this case we need to review the product page.
🔎 How to calculate the unit session percentage: KPIs are available for everyone on Seller Central.
⏱ Frequency: We advise you to look at this KPI on a monthly or quarterly basis, and every time you want to optimize your product page on Amazon.
Bonus:
Top 10 KPIs to track when managing advertising campaigns on Amazon.