2020-02-20
Why understanding your ad creative has never mattered more

One hundred and forty-eight trillion, nine hundred and thirteen billion, nine hundred and forty-one million, five hundred and sixty-two thousand, one hundred.
This is the number of possible variations a personalized email can have.
Or, to be more exact, one of the personalized email campaigns Jellyfish creates on behalf of a car manufacturer.
This colossal figure is made up of variables like the car owner’s name and the maintenance service the email is reminding them about. We can also personalize the image of the car to match the model and color of the recipient’s vehicle.
Even the background image can be changed to suit the season (a reminder to get your brakes checked is more impactful with an icy backdrop).
In the closed environment of a personal inbox, creative decisions about imagery are fairly simple. The data we have permission to use acts as our guide. Yes, the number of possible combinations is vast. But Mrs Hancock owns a blue car. Why would the one in her email be red?
In the wilderness of the web, however – when the map of personalized data is less precise – it’s harder to know which creative elements power performance. Especially when the number of assets you have can run into the thousands.
Deciding which image can, and which image can’t
Pictures work hard. They need to. Especially when they’re worth a thousand words.
It takes experience, creative intuition and data to be able to pick the right visuals for a campaign. Time can give you the first. The second is more elusive, gifted only to some. The third, thankfully, is more attainable.
One way to get insight into which images resonate with your audience is to carry out some research beforehand. This is exactly what Sport England spent five years doing for the This Girl Can campaign.
Launched in January 2015, This Girl Can aims to encourage more women to participate in sports. The initial TV commercial featured women of all shapes and sizes taking part in physical activities. The message? It doesn’t matter what you look like, or what you do. Just get out there and move.
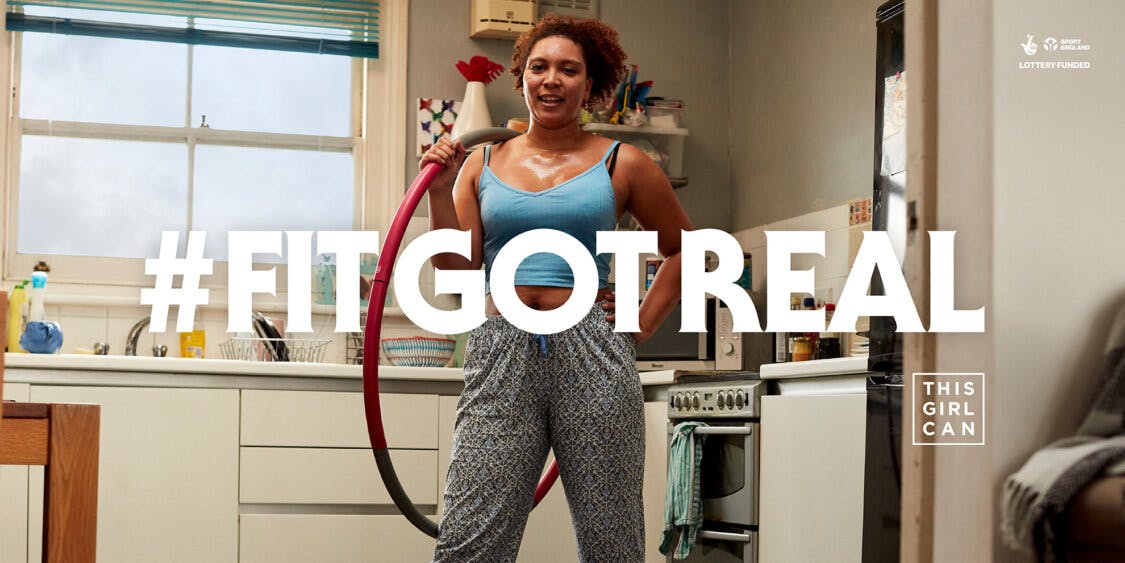
With five years of data to examine, Sport England is getting smarter about how to engage women in sport and exercise. And images are a key driver in the next phase of the campaign. As reported in the Guardian: ‘[Sport England] found…that using photographs of women in the context of the activity rather than actually doing it was more effective in promoting it. So having women standing by their bikes or putting on their helmets in marketing material – as opposed to actually cycling – performed better.’
The success of This Girl Can can’t be measured in the short term. And one image won’t change a woman’s attitude to exercise overnight. Consistency of the message is key in driving behavioral change. But data can make sure that message is right from the start.
Getting smart about creative assets
Let’s go further down the marketing funnel now. At this stage, measurement is more immediate. So understanding what’s working right now really matters.
Creative assets are intrinsically linked to digital advertising performance. Some say as much as 70% of ROI is down to the visuals. Widely believed to have come from Google, this stat has been around a while. In fact, as far back as 2009, it was reported that ‘creative quality is 50% to 75% responsible for campaign success or failure…’ (from a study by Dynamic Logic, published on AdAge).
So we know the value of images. But analyzing creative ad performance is a challenge many businesses have yet to overcome.
Consider our personalized email campaign with its trillions of variables. Now think about the typical creative ad assets for a clothing company. Single product shots. Multiple product shots. Product only. Product on models. Lifestyle imagery. And that’s before you factor in audience segmentation.
Understanding which images work is manual, time-consuming and costly. There must be a better way.
Helping you identify what works
Optics: Creative Intelligence is our solution to the problem of analyzing ad creative at scale. It works by using the Google Vision API to look at thousands of creative variations and visual elements – from facial expressions and objects, to dominant color detection. It can even analyze copy and the call-to-action used.
![]()
So what does this look like in practice?
We partnered with footwear brand UGG to help them understand the correlation between product-based creative and performance. Alongside the standard Optics analysis, our data team built five custom variables for the tool to further evaluate. These variables were:
- Number of shoes
- Number of models
- Placement of shoes
- Placement of models
- Lifestyle versus product creative
From our analysis, the number of products appearing in images seemed to have an interesting impact on click-through-rates (CTR). To find the best number of shoes to include, we set up an A/B test to uncover that magic number.
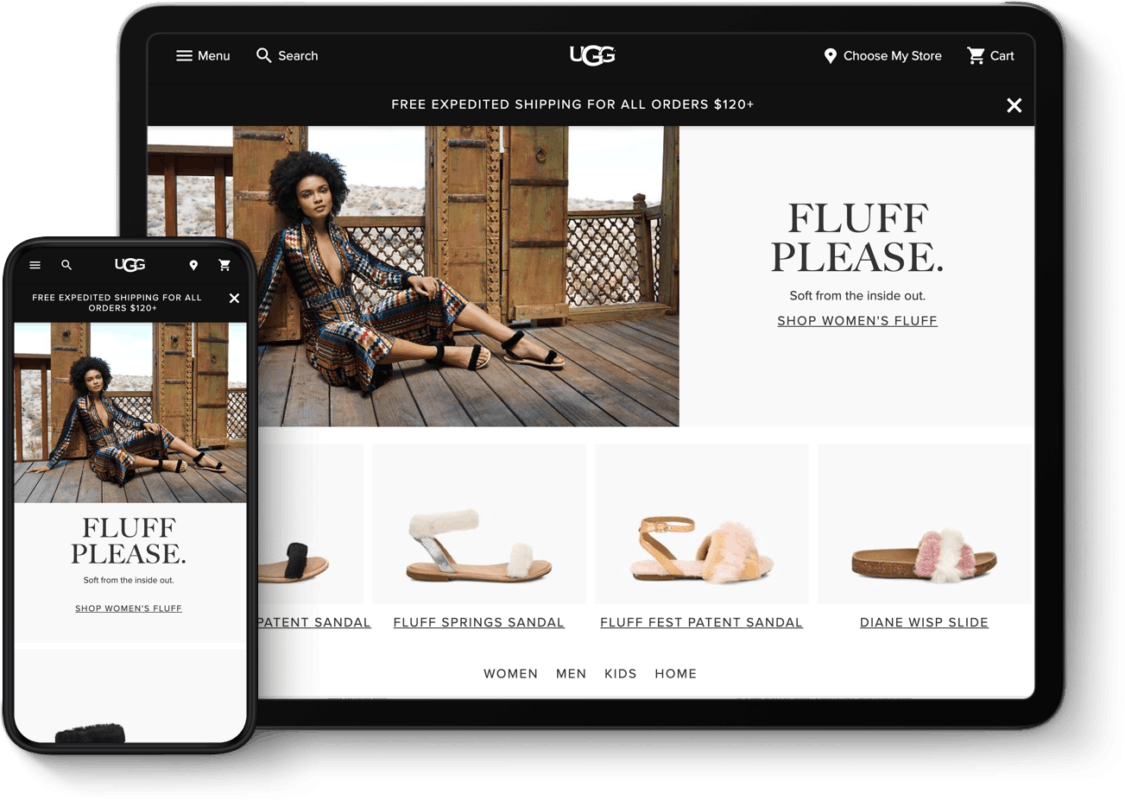
For UGG, four shoes is the optimum number of products to show in each ad. And by using this insight, the CTR of display ads has increased by 26%. We’ve also used this knowledge to inform future campaigns, as well as provide a baseline for further testing. Read the case study to find out more about the work we did for UGG.
A strategy for the future
Automating creative analysis has benefits beyond just your current campaigns. Learnings can be incorporated into brand-level best practices, as well as inspire new and innovative ideas. This gives you a more precise map to guide your creative decisions.
If you need to smarten up your creative get in touch with our team!